
Databricks Dashboards VS PowerBI: Understanding the Differences
Power BI or Databricks Dashboards - which one is better? We break down the strengths and how they can work in harmony to power your data strategy.

Data has become one of the most powerful assets in modern business. Modern analytics platforms continue to develop rapidly as demand and businesses continue to grow. Organizations are rethinking their platform strategies to meet the growing demands of their businesses. Power BI still seems to be the leading tool and first choice of many companies. People are familiar with the Microsoft ecosystem, it’s convenient and it’s right there. There’s often little motivation to do deeper research. The visualizations are strong, dashboards are clean, and everything feels just one click away.
So, what happens when Power BI no longer meets all your needs? Or when your data maturity grows beyond what a traditional BI tool can support?
We recently spoke with a client who asked exactly that. As their business intelligence partners, we took a deeper dive into this and explored Databricks Dashboards as an alternative. Our findings may help you decide which direction is right for your organization
Understand the difference and what fits your needs
While both tools are robust and superficially similar, they typically fulfill different functions.
Databricks Dashboards are a feature within the Databricks lakehouse platform, ideal for technical users who need to quickly build simple analytics dashboards on their governed data.
Power BI is a separate, dedicated business intelligence tool that offers more advanced and user-friendly visualization and reporting capabilities, often used by a wider range of users by connecting to data sources like Databricks.
Essentially, Databricks Dashboards provides powerful data processing and governance foundation, while Power BI provides a comprehensive front-end visualization layer, making them complementary tools rather than direct competitors.
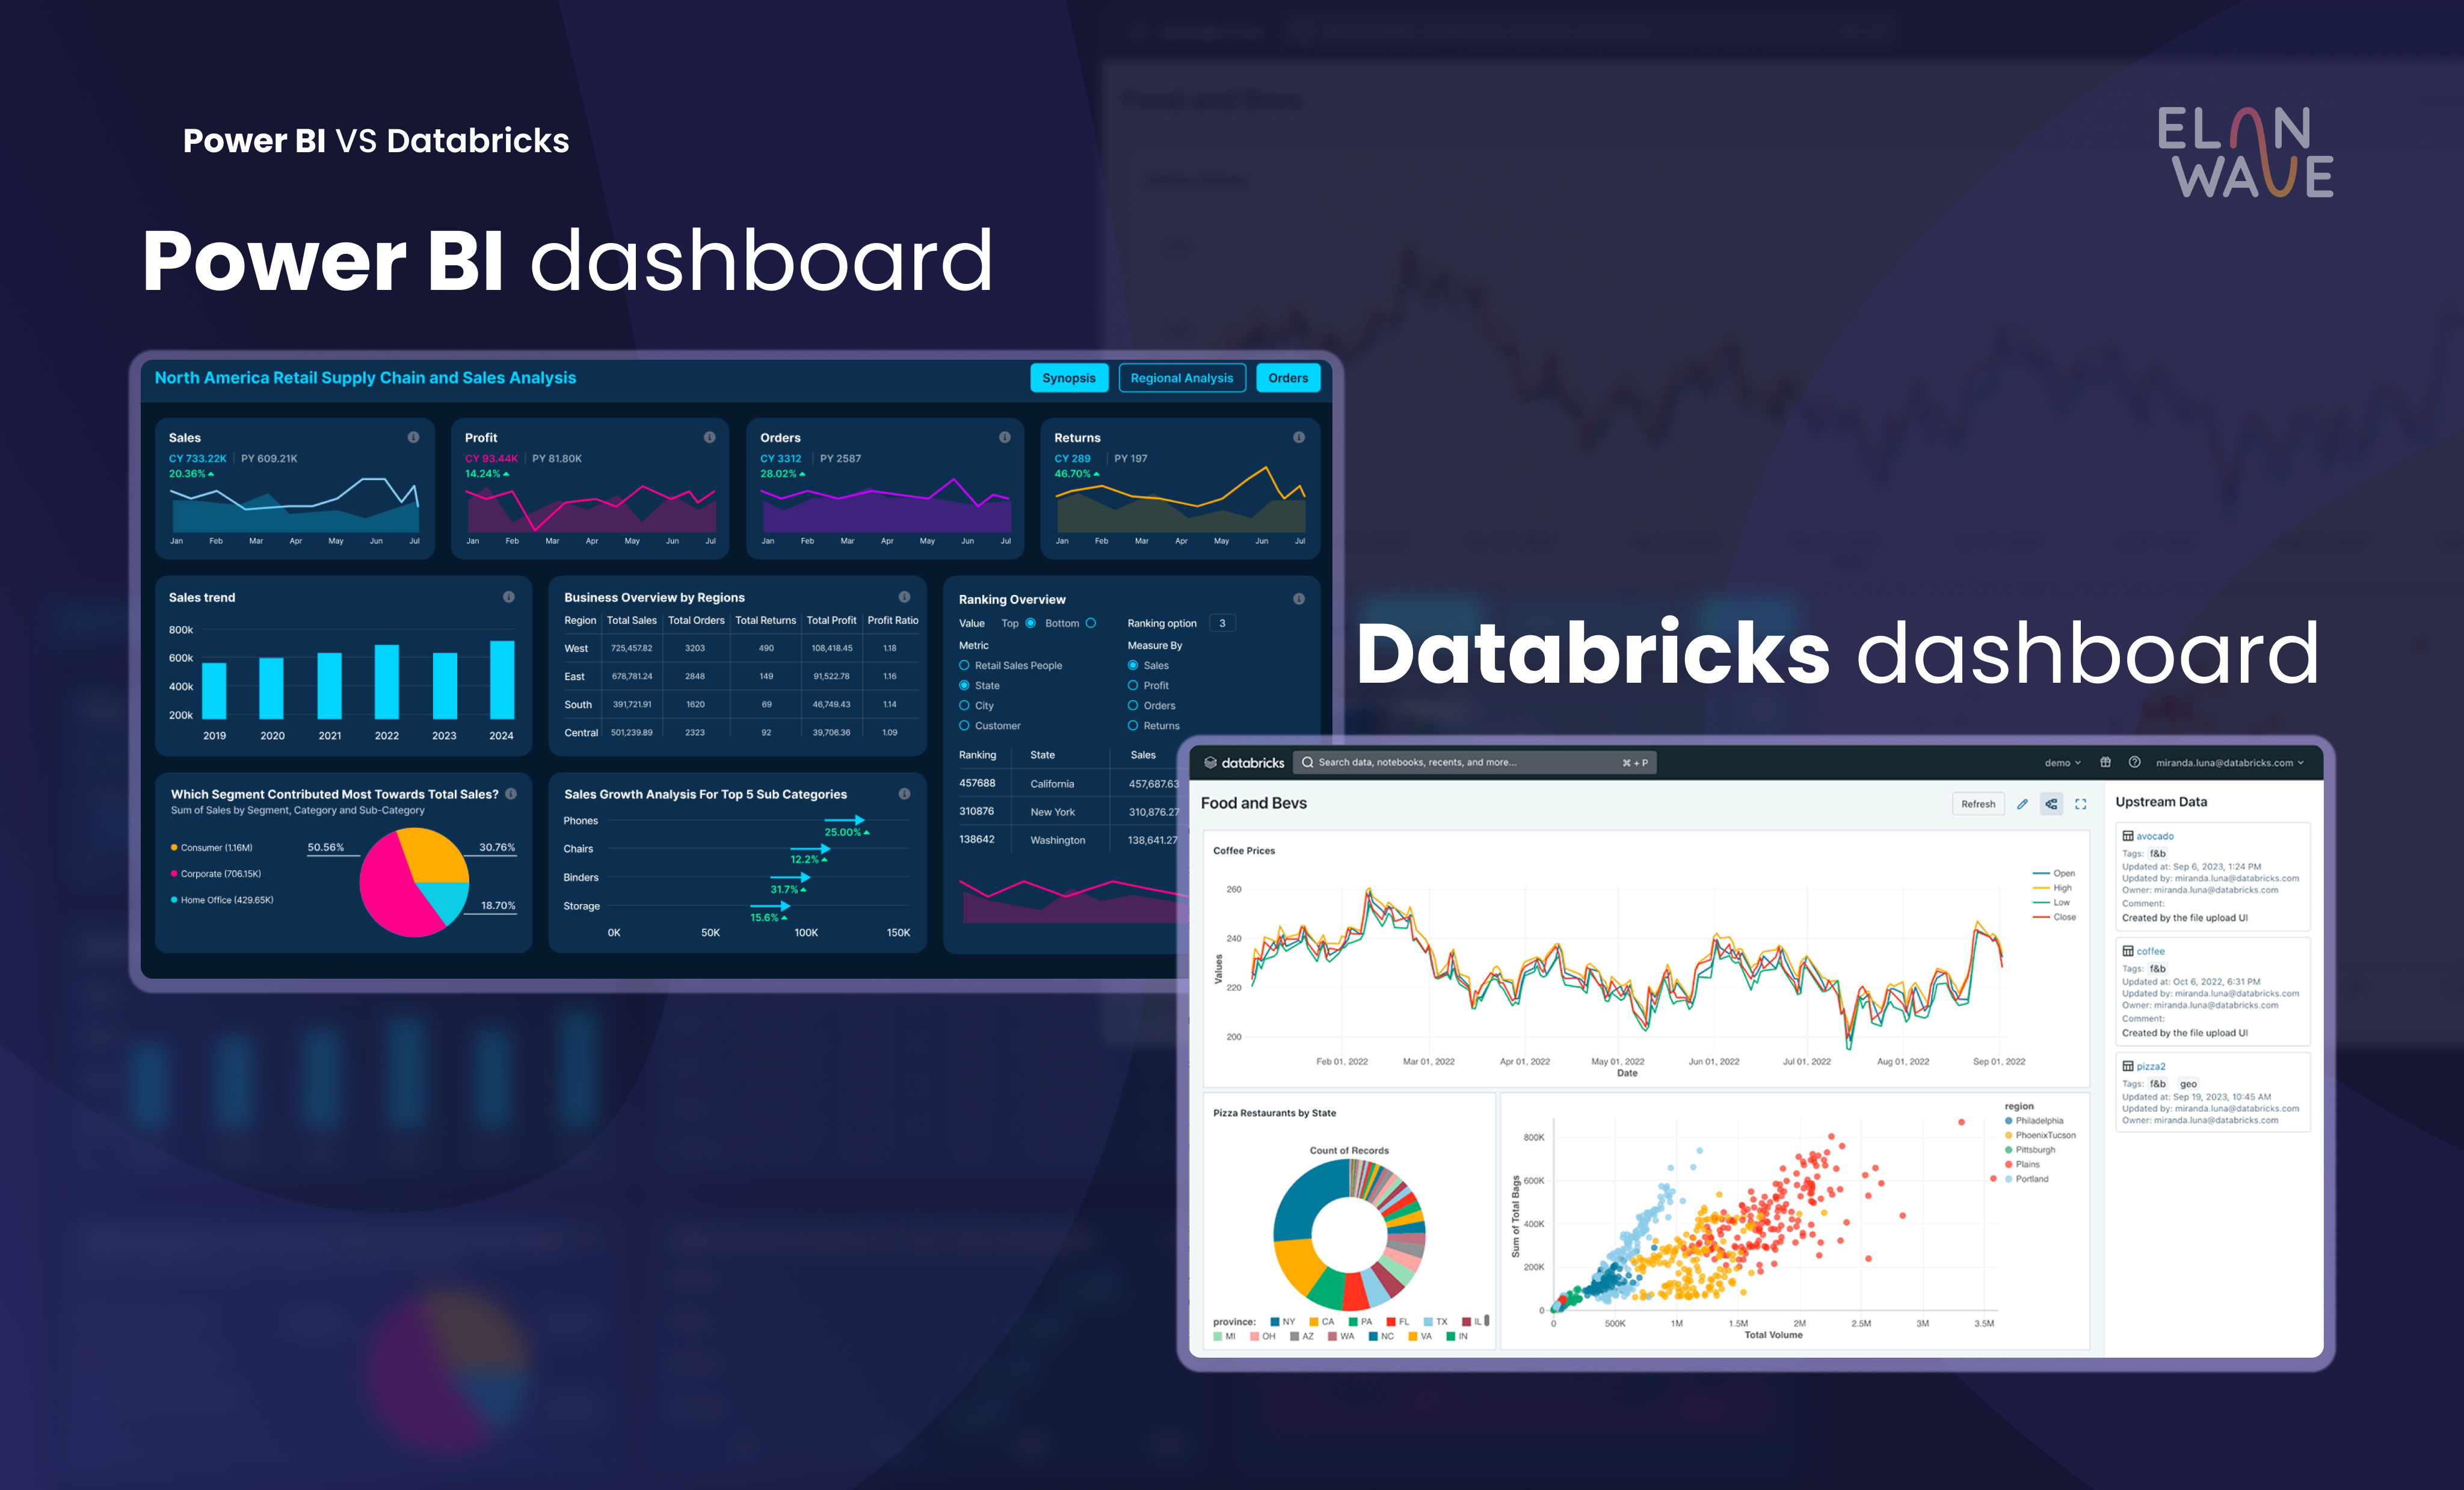
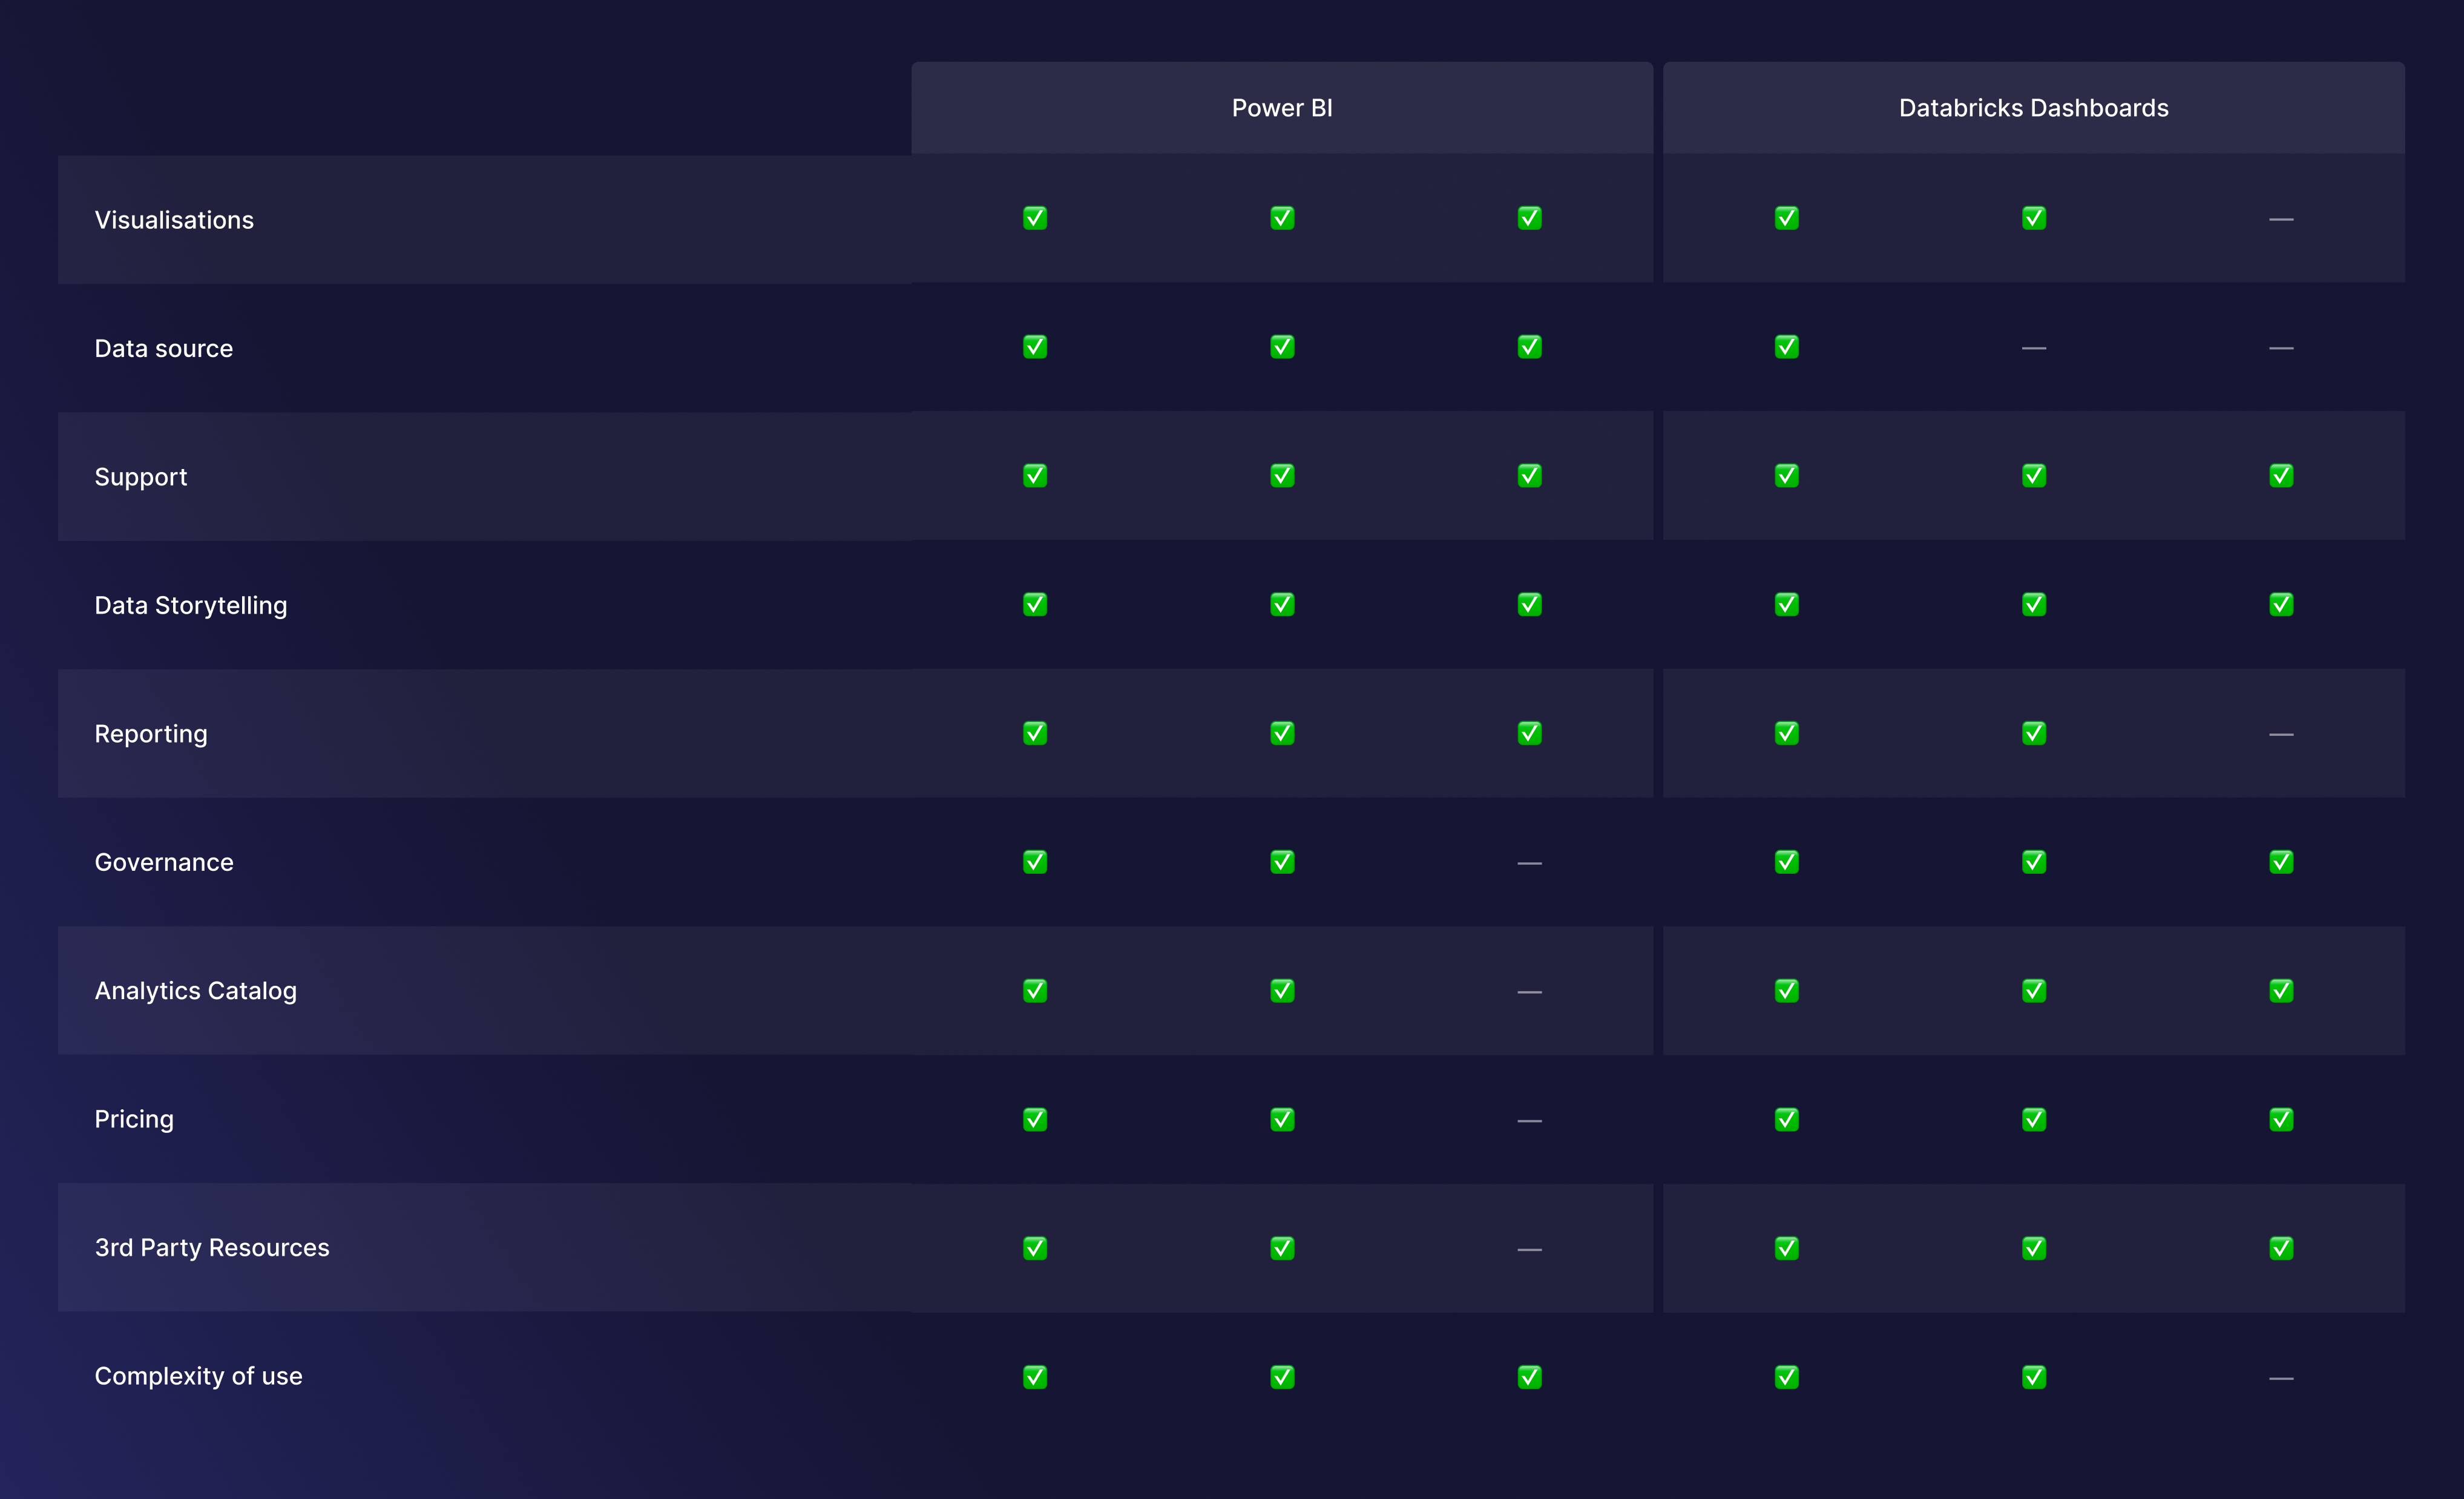
Side by side comparison
Databricks Dashboards
Databricks Dashboards is best for data engineers, data scientists, and analysts who are already working within the Databricks environment.
Databricks Dashboards strengths are:
- Simplicity (drag and drop interface for creating basic dashboards),
- Integration (seamlessly connects to data residing in the Databricks lakehouse, leveraging Unity Catalog for governance)
- AI-assisted visualization (includes AI features that generate charts from prompts)
- Cost-effectiveness (no separate licensing fees, costs are tied to the underlying Databricks compute and storage)
Databricks limitations are:
- Fewer advanced features compared to dedicated BI tools like Power BI
- User interface can take getting used to for those accustomed to traditional BI tools
- Less customization in some areas, such as chart formatting
Power BI
Power BI is best for a broad range of users, from business analysts to executives, who need to create sophisticated and interactive reports and dashboards.
Power BI strengths are:
- Comprehensive features (offers a wide array of advanced visualization options, filtering, and interactive elements)
- User-friendly interface (known for being easy to use for creating complex dashboards and reports)
- Integration capabilities (can connect to numerous data sources, including Databricks, for robust data analysis)
Power BI limitations are:
- Separate cost, separate licensing
- Requires connection meaning that it needs to be explicitly connected to a data source like Databrick to function
- Can be complex at times, simply because of the features it provides even for the simple use cases.
Databricks Dashboards and Power BI are complementary tools
Both Databricks Dashboards and Power BI bring a unique set of strengths to the table. As we mentioned before, it really comes down to what your needs are. It is not strange to combine both tools and have a complete image of your data, a broader data strategy. Some companies share these experiences.
If you have a technically skilled team, Databricks Dashboards might be the right fit. But if you need a more user-friendly tool that integrates seamlessly into the Microsoft ecosystem, Power BI is a strong choice for visualization and business intelligence.
These topics are complex and rarely have a single correct answer. They require a deep understanding of business needs and a clear long-term vision. The tools will continue to evolve, and we’re excited to see what the future brings. But, at this moment, Power BI remains to be a more mature option and great data tool overall.
If you're looking to strengthen your data strategy, evaluate your analytics ecosystem, or explore Power BI in more depth, we’re here to help. With a free consultation, of course.
We're just one email away.
Book free consultation
Let's talk!